The First 14 Days: How We Find the Constraint Slowing Your Revenue
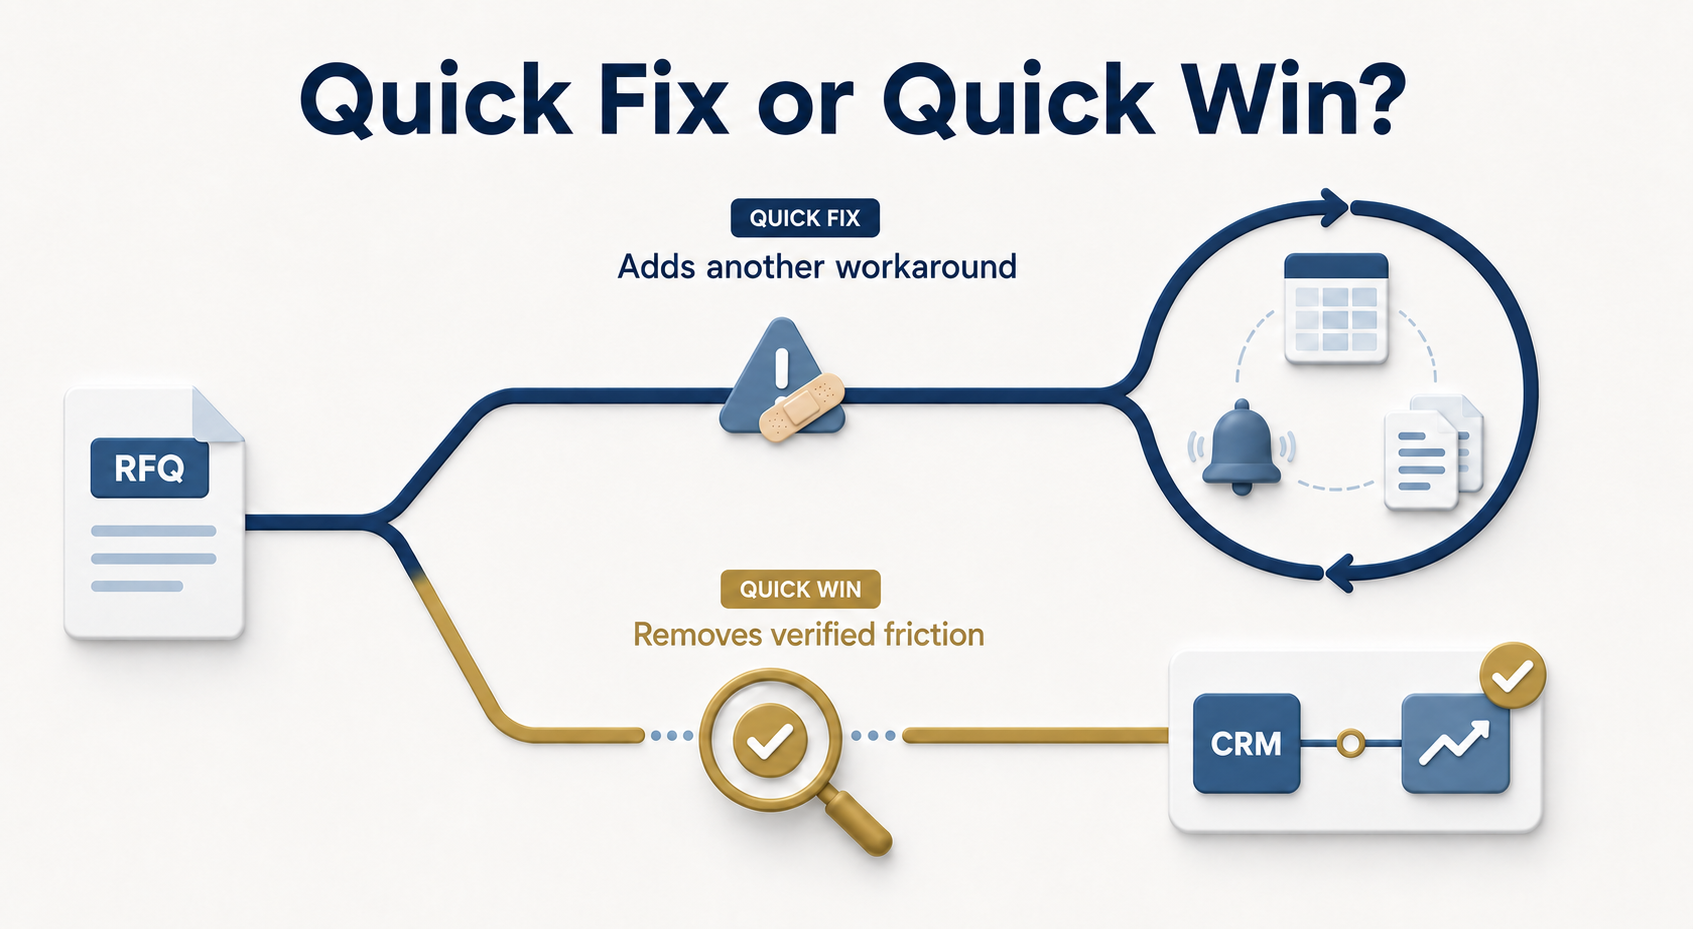
When revenue growth slows, the natural impulse for many manufacturers is to reach for a quick fix. If forecasting feels off, leadership asks for a new dashboard. If leads stall, marketing considers another automation tool. If sales activity seems low, managers push for more outreach.
It makes sense to address the problem you can see. But when the same issues keep returning, there’s usually something deeper happening in the revenue system. What looks like a forecasting or follow-up problem may have started several steps earlier.
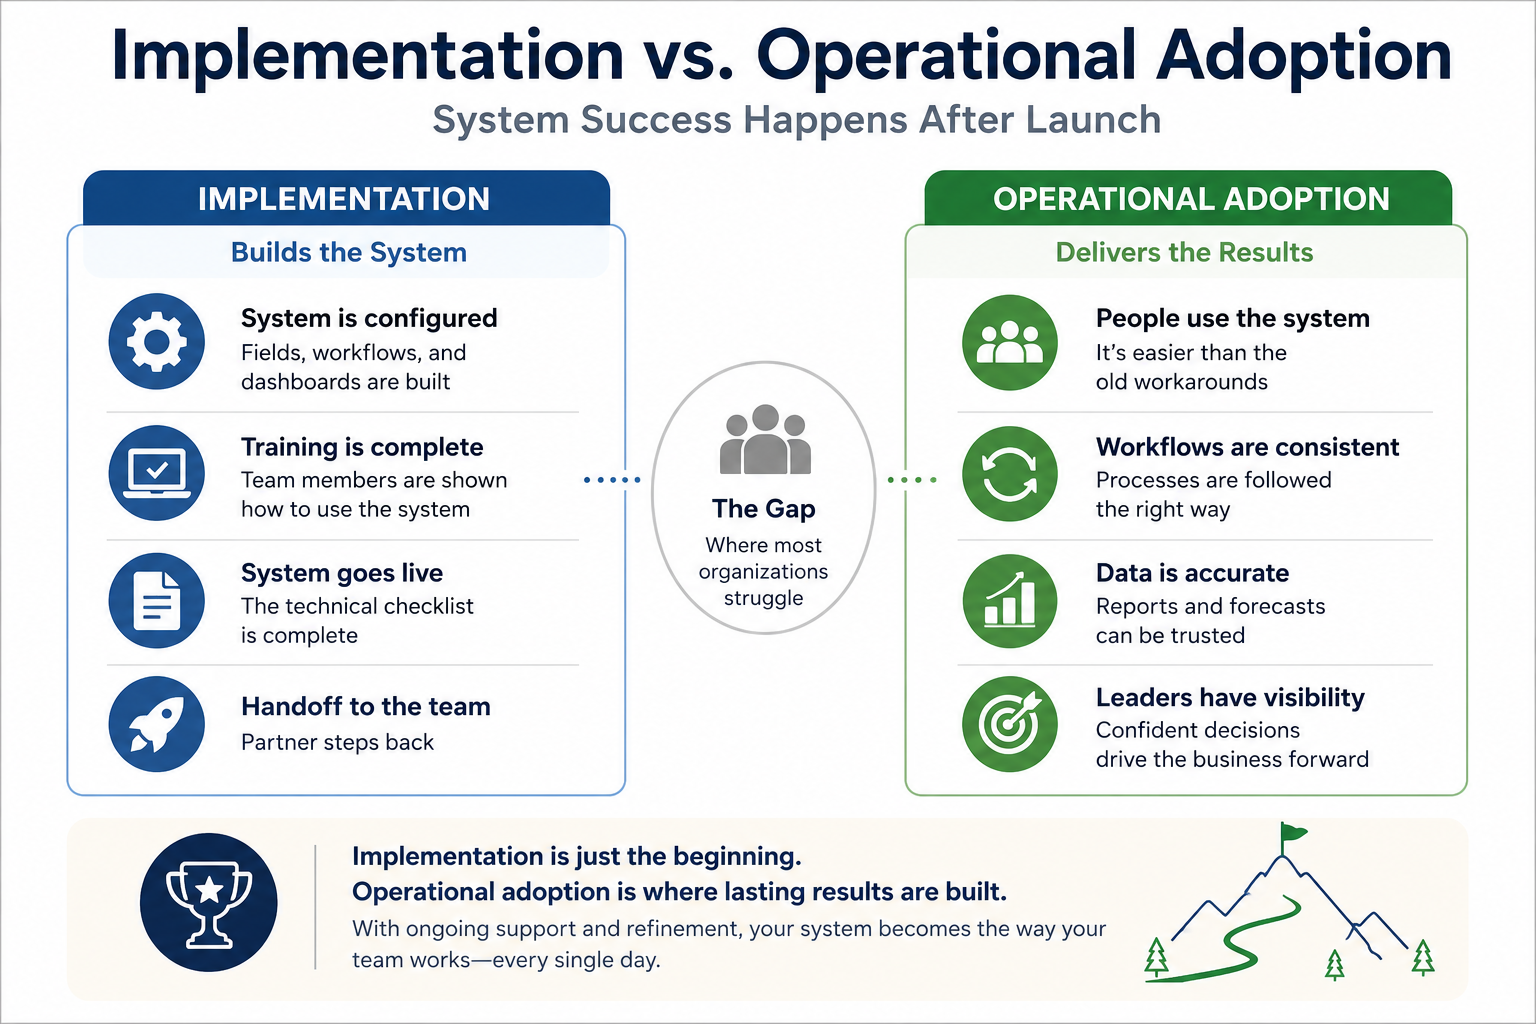
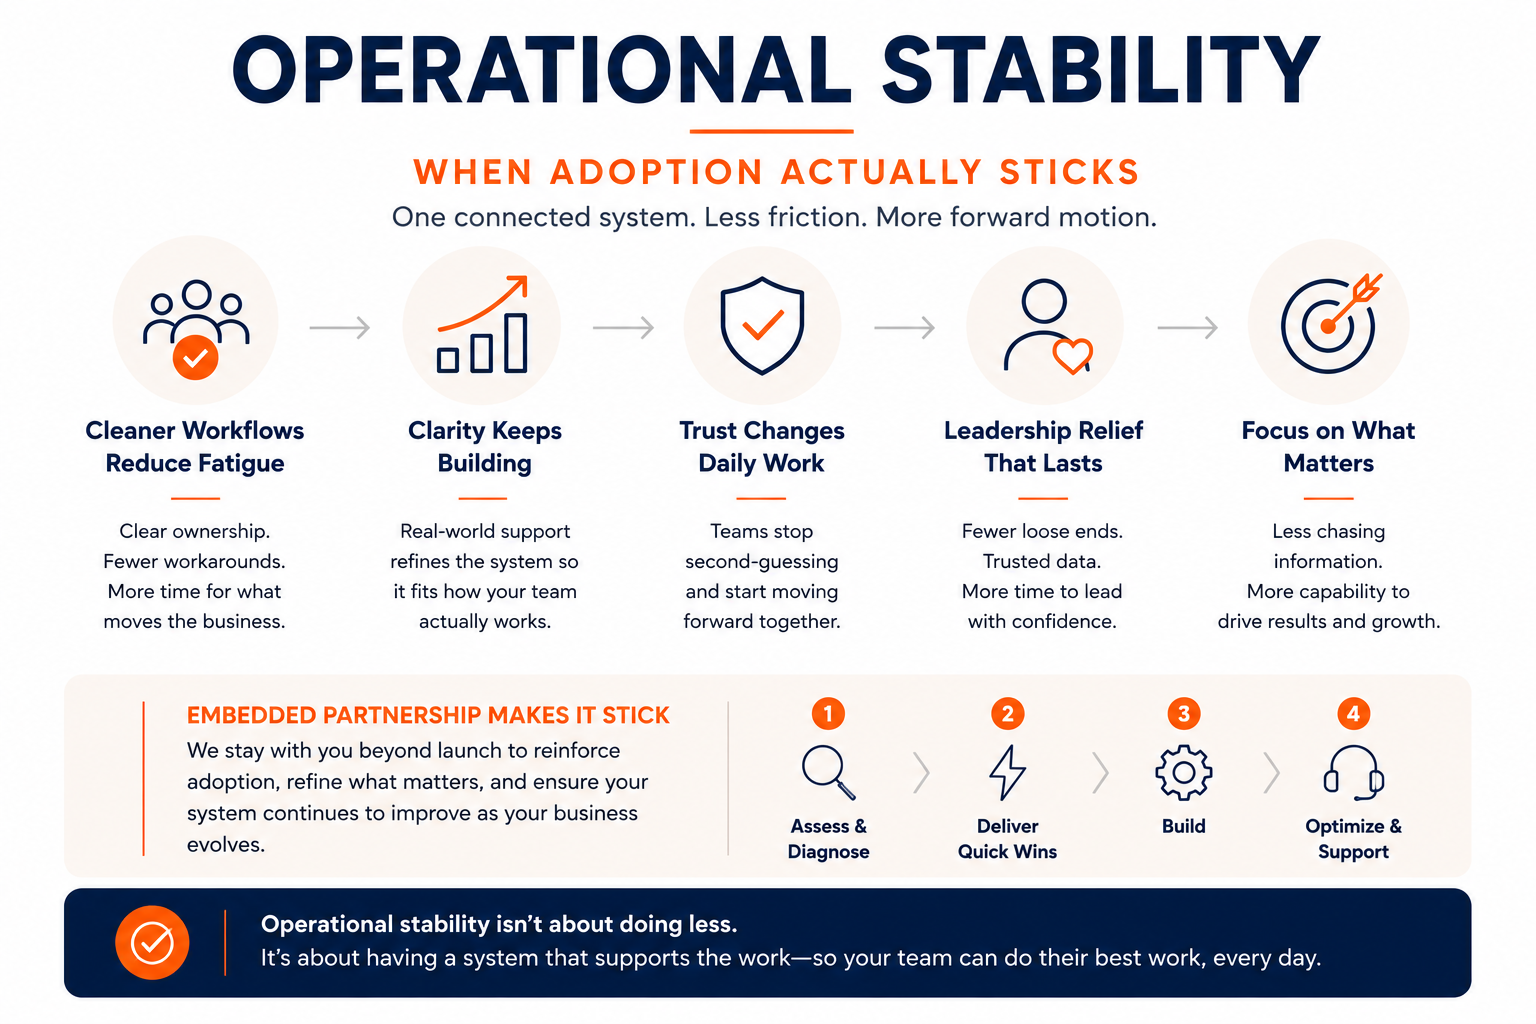
That is where we start. Before we recommend a new process or reconfigure a tool, we look at how work actually moves through the business. During our Assess & Diagnose phase, we follow the data, decisions, ownership, and handoffs to find where the system is actually breaking down, not just where the problem becomes visible.
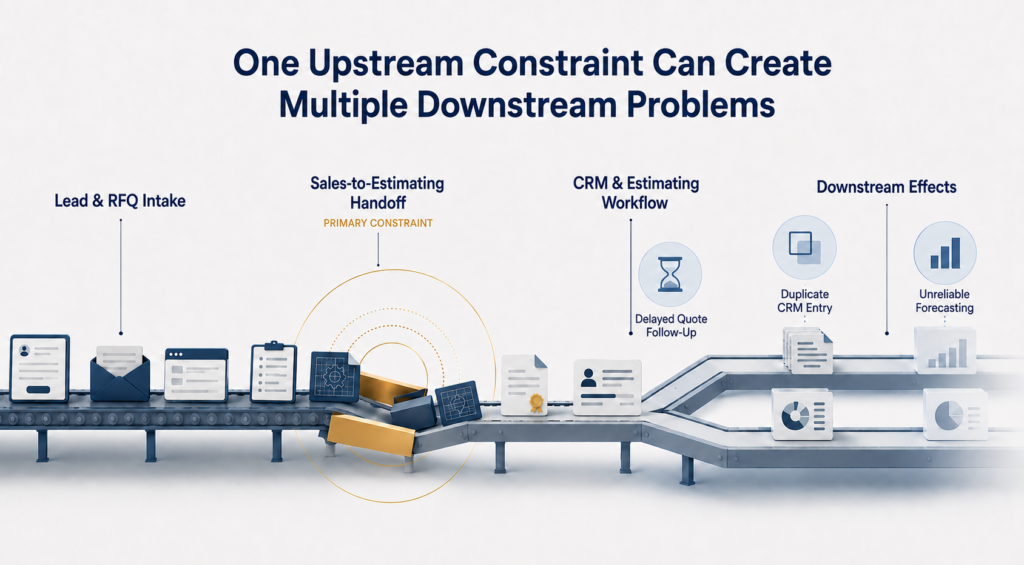
We Start Where Revenue Enters and Follow It Forward
Our diagnostic typically begins by walking the path a lead or RFQ takes from first contact to closed order. We look across six operational areas:
- Lead & RFQ Intake: How demand enters the business and what information is captured at the start.
- Qualification & Technical Scoping: How marketing, sales, and estimating determine whether an opportunity is a fit.
- Ownership & Accountability: Who’s responsible for advancing the opportunity at each stage and where handoffs lack explicit owners.
- Data Flow & System Connections: How information moves between marketing platforms, the CRM, estimating tools, and the ERP.
- Cross-Functional Handoffs: How information passes among direct sales, distributor networks, applications engineering, estimating, and operations.
- Reporting & Visibility: How leadership gathers pipeline data and whether the data requires manual cleanup before it can be used.
We’re not looking at departments in isolation. Revenue performance depends on the system connecting those functions.
What Workflow Mapping Reveals
Once we map the real workflow, patterns begin to surface.
Workflow mapping exposes where information is:
- Delayed: Quote requests sitting in an inbox awaiting manual technical assignment.
- Duplicated: Reps re-keying customer specs from an email into a quoting sheet, then again into a CRM opportunity.
- Lost: Distributor leads or web inquiries dropped during handoffs because no clear owner was assigned.
- Manually Reconstructed: Sales operations spending hours every Friday compiling custom reports for leadership.
Consider a common example: An estimate is sent, but the CRM never reflects it, so sales follows up late or not at all. Leadership may see a dropped ball. But when we trace the workflow, we may uncover an unclear handoff, missing system trigger, or ownership gap that allows the problem to keep repeating. More reminders will not resolve the issue if the system still makes the next step unclear.
Symptom or Constraint?
An inaccurate forecast or dropped follow-up is often a symptom, not the underlying problem. This is where an engineering-led diagnosis matters.
Separating Visible Symptoms from Primary Constraints:
Fixing a symptom without finding the constraint will likely create another workaround, often in a different part of the process, that someone will eventually have to manage around.
Symptom: “Our reps aren’t updating the CRM.” Real Constraint: CRM setup forces reps to complete 15 duplicate data fields providing zero value to their day-to-day workflow.
Symptom: “Our sales forecasts are completely inaccurate.” Real Constraint: Sales, estimating, and leadership use different definitions for what a “qualified opportunity” actually means.
Symptom: “Marketing leads are low quality.” Real Constraint: There’s no documented handoff or technical qualification process between lead intake and sales follow-up.
Evaluating System Readiness Before Change
Before suggesting new software, a process shift, or a reporting change, we consider six factors:
- Information Flow: Where’s information delayed, duplicated, lost, or manually reconstructed?
- Decision Ownership: Who owns each decision and next step?
- Downstream Effects: How’s the friction affecting follow-up, forecasting, reporting, or visibility?
- Technology Usability: Is software failing, or is it configured around a workflow that no longer works?
- Team Capacity: Can the team absorb a change now, or should immediate friction be removed first?
- Operational Clarity: Does everyone understand their responsibilities and cross-functional handoffs?
Once those conditions are clear, we can determine whether the first change belongs in the workflow, ownership, or technology and in what order changes should happen.
What Leadership Gains at Day 14
By the end of the diagnostic period, leadership should have more than a list of disconnected issues. You should have a clearer view of how the revenue system operates, where friction is creating downstream problems, and what to address first:
- Mapped revenue workflow showing how work, data, and decisions move through your organization.
- Defined primary constraint identifying where the greatest friction is occurring.
- Identified ownership gaps showing where responsibility becomes unclear.
- Connected downstream effects explaining how the constraint may be affecting multiple surface-level symptoms.
- Highest-leverage first action designed to deliver immediate relief and quick wins without causing operational chaos.
That clarity changes the conversation. Instead of asking, “Which tool should we buy?” leadership can ask, “What does the system need to make the right action easier, clearer, and more consistent?”
Curious where your own revenue system might be losing time or visibility? Take the Revenue System Friction Check to identify which part of your system may need a closer diagnostic look.